Article care of low-carb-diet-plan.com
A diabetic diet helps prevent type 2 diabetes and obesity
The plasma glucose values were compared between sixteen thin individuals and sixteen obese individuals following the ingestion of a carbohydrate load at different time intervals, 0 (fasting), 1/2 hour, and 1 hour. The age, sex,
height, and weight of each individual were recorded. The ages of all thirty-two individuals ranged from 23 to 65 years old.
None of the individuals had any known diseases. Each individual was randomly assigned an identification number and was divided into one of two groups based on their weight. Individuals making up the thin group were assigned I.D. numbers 1 through 16. Individuals making up the obese group were assigned I. D. numbers 17 through 32.
Each individual was labeled thin or obese based on ideal body weight charts published by the Metropolitan Life Insurance Company. The carbohydrate load consisted of a commercial preparation of l00 grams of glucose manufactured
under the trade name, Glucola.
The plasma glucose samples were drawn and determined at State licensed and accredited diagnostic blood laboratories. The blood tests were performed in the morning after a 12 hour overnight fast. Statistical analysis of comparisons between groups was performed using the student t test. A p value < .0l is considered statistically significant.
TABLE 1. Plasma glucose values in 16 thin individuals following an oral carbohydrate load (100 grams of glucose) at various time intervals.
ACCORDING TO AGE, SEX, HEIGHT, AND WEIGHT
Normal Range Glucose Values:
less than 50 years of age 70-115 mg/dL
50 years of age or older 80-125 mg/dL
TABLE 2. Plasma glucose values in 16 obese individuals following an oral carbohydrate load (100 grams of glucose) at various time intervals.
ACCORDING TO AGE, SEX, HEIGHT, AND WEIGHT
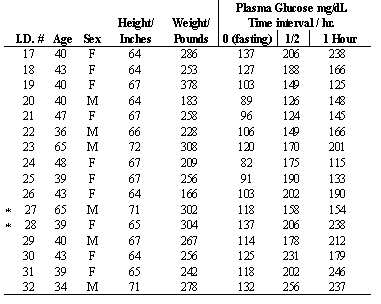
Normal Range Values:
Glucose less than 50 years of age 70-115 mg/dL
50 years of age or older 80-125 mg/dL
* These individuals had simultaneous assays of their plasma glucose, insulin, and trypsin levels, at various time intervals over a period of five hours.
The data in table 1 shows that the 16 thin individuals (nos. 1-16) had significantly lower fasting blood glucose values compared to the l6 obese individuals (nos. 17-32).
The mean 0 (fasting) blood glucose value for the 16 thin individuals (nos. 1-16) in table 1 are 81.0 ± 8.0. The standard error of the mean is 1.98. The mean 0 (fasting) blood glucose value for the l6 obese individuals (nos.17-32) in table 2 is 112.0 ± 17.0. The standard error of the mean is 4.33.
The data in table 1 shows that the 16 thin individuals (nos.1-16) developed hyperglycemia following an oral carbohydrate load, but had significantly lower blood glucose values at the 30 minute time interval than the 16
obese individuals at the same time interval following an oral carbohydrate load.
The mean blood glucose value of the 16 thin individuals (nos. 1-16) at the 30-minute time interval is 123.31 ± 28.65. The standard error of the mean is 72.12. The mean blood glucose value of the 16 obese individuals (nos. 17-32), at the 30-minute time interval is 181.88 ± 35.96. The standard error of the mean is 8.99.
The data in table 1 shows that the 16 thin individuals (nos. 1-16) had blood glucose values below fasting levels at the 1 hour time interval. The sixteen obese individuals had significant hyperglycemia at the 1 hour time interval. The mean glucose value for the 16 thin individuals (nos. 1-16) at the 1 hour time interval is 68.94 ± 7.27. The standard error of the mean is 1.81. The mean glucose value for the 16 obese individuals (nos. 17-32) at the one-hour time interval is 180.8125 ± 43.71. The standard error of the mean is 10.93. The difference between the means yielded at value of 10.10, for which the P value is < .01
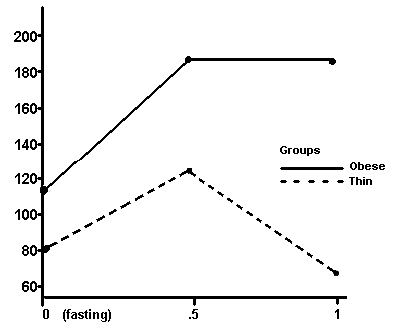
Figure 1. Shows the comparison between the mean glucose values at various time intervals for 16 thin and 16 obese individuals following the ingestion of identical carbohydrate loads . The blood glucose returned to below fasting values in 1 hour in the thin group. The obese group had sustained hyperglycemia at the 1-hour time interval.
Group means differed significantly at each time interval.
P< .001.
Lose weight and get fit with the Internet's most respected fitness and weight loss magazine. Our Low Carb Diet and Fitness Magazine will inform you about the latest medical
research and scientific studies on weight loss and fitness translated into practical ideas you will put to work immediately.
Sign up for your FREE weekly magazine now.
© 2001-2021 LowCarbSuccess.net
|